
OEE SOFTWARE
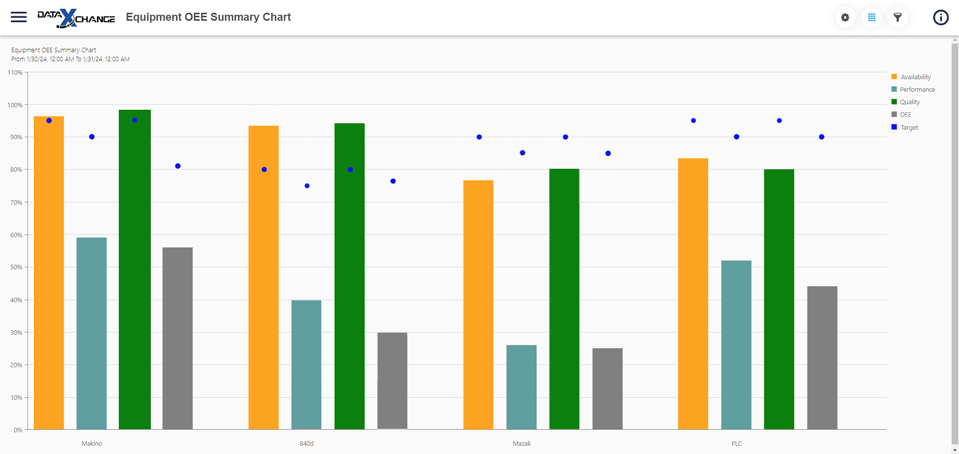
OEE (Overall Equipment Effectiveness) is a metric that is considered a best practice to remove waste from a process, resulting in increased utilization. And OEE Machine Monitoring is the ideal way to achieve that result.
The concept behind OEE is to capture the data needed to measure components of the full manufacturing process to get an overall picture of how effective the process is. OEE is broken down into three components; Availability, Performance, and Quality. Availability is determined by the equipment being available for production when the equipment has been scheduled to run by tracking unplanned stops relative to planned stops. Performance refers to how much loss there is by running at less than optimal speed by comparing the actual run times against the ideal cycle times. The Quality calculation identifies waste of producing parts that are below an acceptable standard by taking the ratio of good parts over all parts produced.
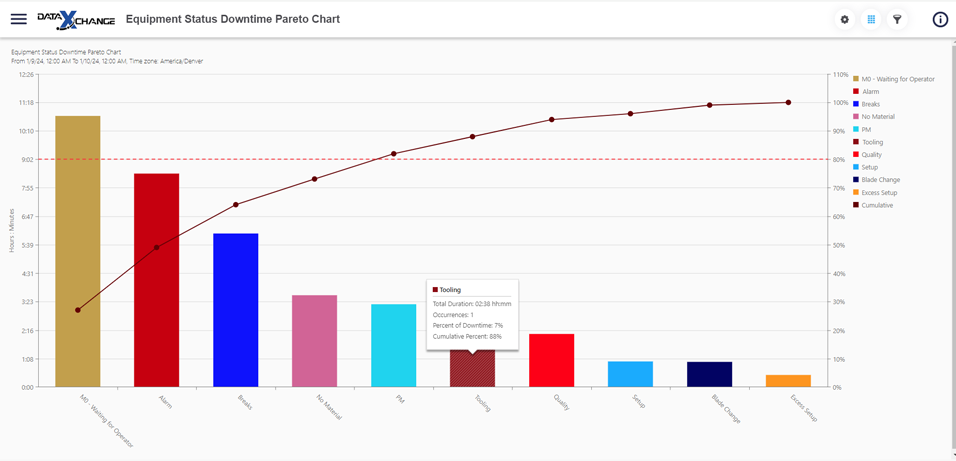
OEE DOWNTIME TRACKING
The Scytec DataXchange OEE software uses real-time equipment monitoring as well as automatic and manual collection of planned and unplanned downtimes to improve asset utilization. The DataXchange OEE software provides machine downtime tracking allowing for the identification of the waste while automatic tracking of the machine activities allows for capturing the run rate.
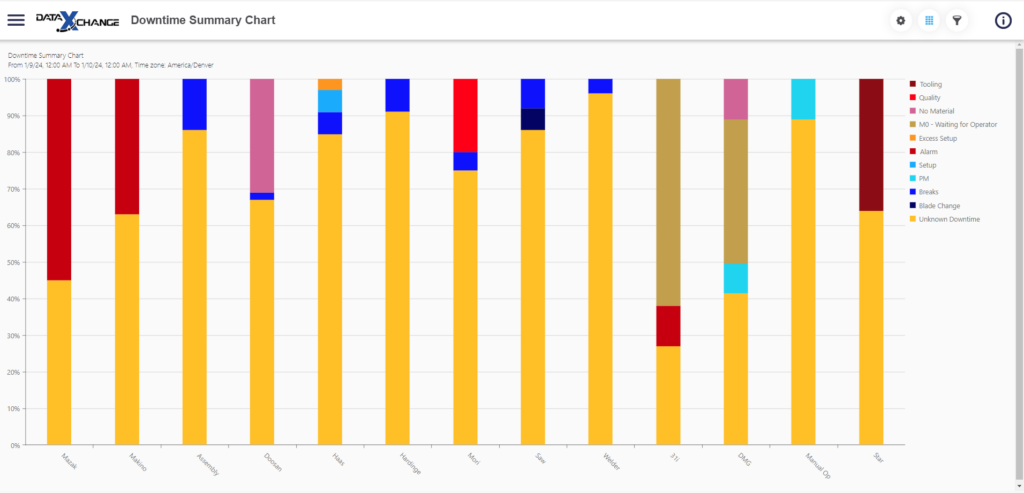
The active part number and part counts can be captured directly from some machine controls, or can be entered from the DataXchange Data Entry screen. In addition, the Data Entry screen provides the ability to enter scrap parts for the quality portion of the OEE calculation.
With all of the variations in manufacturing processes and manufacturing equipment a key to a successful OEE machine monitoring implementation is to have software that has flexible, yet powerful data collection rules. In addition to the data collection rules, reports, charts and real time dashboards to expose and share the data is essential for the long term and ongoing success of a machine monitoring system.
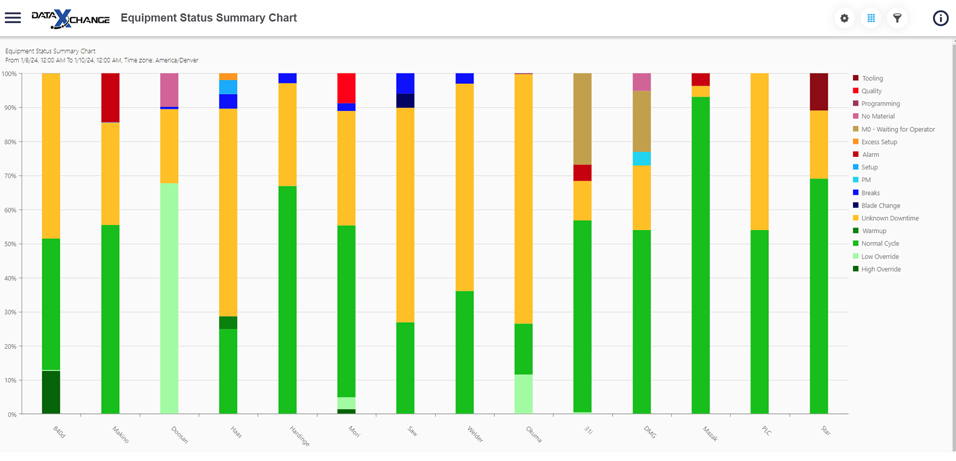
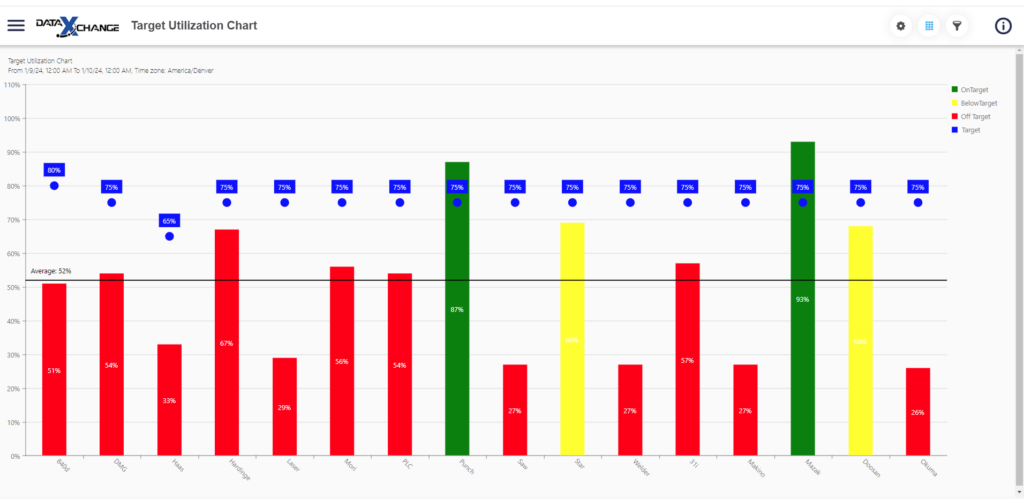
SAMPLE CHARTS
The equipment status charts show the percentage of time in each status for a selected time period. The charts can be displayed showing individual pieces of equipment groups allowing the viewing and comparing of statuses.